
 Explore Worlds
 Find Life
 Defend Earth
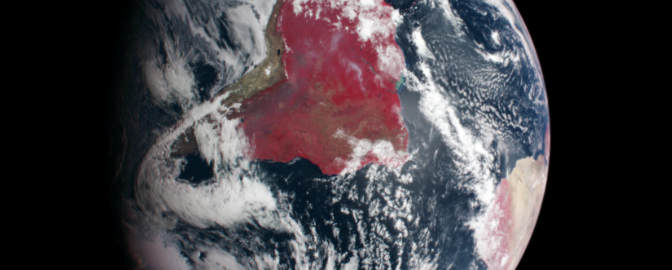


Global-scale Observations of the Limb and Disk (GOLD)

Mission Overview
SES-14 is a hybrid satellite with C- and Ku-band wide beam coverage, as well as Ku- and Ka-band High Throughput Satellite (HTS) coverage across the Americas and the North Atlantic region. The satellite will fully rely on electric propulsion and will be equipped with an electric plasma propulsion system for orbit raising and in-orbit manoeuvres. The electric propulsion system delivers significant reduction in the weight of the satellite, enabling larger payloads to be carried. The new spacecraft will also feature a Digital Transparent Processor (DTP), increasing the payload flexibility to provide customized bandwidth solutions to SES's customers.
The SES-14 payload includes the Global-scale Observations of the Limb and Disk (GOLD) instrument for earth science and heliophysics studies.
Note: Mission information is from NASA's Space Science Data Coordinated Archive.
Spending Summary
| FY 2024 Total | By Jul of FY 2024 | By Jul of FY 2025 | Change from FY 2024 | |
|---|---|---|---|---|
| Obligations | $3.5M | $3.5M | $1.8M | $-1.7M |
| Outlays | $5.0M | $4.0M | $3.0M | $-1.0M |
Comparing Contract Obligations

Running sum of 1 award. Shows cumulative actual spending by fiscal period. Period 2 represents combined Oct-Nov data (this is a reporting quirk of USASpending.gov). Negative values indicate adjustments or credits. Data last updated: 2025-09-18
Download Options
What are obligations? Obligations represent NASA's legal commitments to spend money — contracts signed, grants awarded, and purchase orders issued. Unlike outlays (actual payments), obligations show when spending decisions are made.
Reading this chart: The chart displays cumulative obligations throughout the fiscal year (October through September). The solid line shows the current fiscal year's running total, while the dotted line (when available) shows the previous year for comparison. This allows you to see spending patterns and track whether funding is ahead or behind the prior year's pace.
Comparing Contract Outlays

Running sum of 1 award. Shows cumulative actual spending by fiscal period. Period 2 represents combined Oct-Nov data (this is a reporting quirk of USASpending.gov). Negative values indicate adjustments or credits. Data last updated: 2025-09-18
Download Options
What are outlays? Outlays represent actual cash payments made by NASA. While obligations show when spending decisions are made, outlays show when money actually leaves the treasury.
Reading this chart: The chart displays cumulative outlays throughout the fiscal year (October through September). The solid line shows the current fiscal year's actual spending, while the dotted line (when available) shows the previous year for comparison. This reveals the actual cash flow timing and whether spending is keeping pace with the prior year.