
 Explore Worlds
 Find Life
 Defend Earth
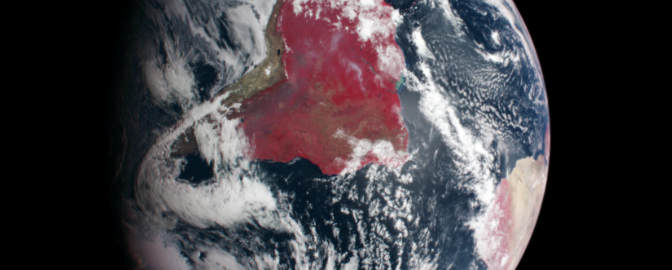


Juno

Mission Overview
The Juno mission was launched on 05 August 2011 to study Jupiter from polar orbit for approximately one year beginning in 2016. The primary scientific objectives of the mission are to collect data to investigate: (1) the formation and origin of Jupiter's atmosphere and the potential migration of planets through the measurement of Jupiter's global abundance of oxygen (water) and nitrogen (ammonia); (2) variations in Jupiter's deep atmosphere related to meteorology, composition, temperature profiles, cloud opacity, and atmospheric dynamics; (3) the fine structure of Jupiter's magnetic field, providing information on its internal structure and the nature of the dynamo; (4) the gravity field and distribution of mass inside the planet; and (5) Jupiter's three-dimensional polar magnetosphere and aurorae. Juno carries eight experiments to achieve these objectives. Juno was the second mission chosen for the New Frontiers program.
Spacecraft and Subsystems
The spacecraft is built around a hexagonal cylinder bus measuring 3.5 m in diameter by 3.5 m high. Three solar panel wings extend from alternate sides of the hexagon giving a total diameter of approximately 20 m. A high gain antenna is mounted on top of the bus, with instruments mounted on the deck and propellant, oxygen, and pressurant tanks mounted within. At the center of the top deck is a 0.8 x 0.8 x 0.6 m titanium "vault" which houses the spacecraft avionics and critical systems to protect them from the severe jovian radiation environment. The vault has a mass of 150 kg and walls up to over a cm in thickness. Power is provided by ultra triple junction GaAs solar cells, covered with thick glass for radiation shielding, which are grouped into 11 solar panels, four on two of the wings and three on the other. (The end of the third wing is a boom structure holding science instruments.) The solar panels will produce a total of 18 kW at Earth and 400 W initially at Jupiter. The science payload comprises ten instruments: the Jovian Auroral Distributions Experiment (JADE), the Jupiter Energetic-particle Detector Instrument (JEDI), the Ultraviolet Spectrograph (UVS), the JunoCam, the Jovian Infrared Auroral Mapper (JIRAM), the Plasma Waves Instrument (Waves), the Microwave radiometer (MWR), the Fluxgate Magnetometer (FGM), the Advanced Stellar Compass (ASC), the Scalar Helium Magnetometer (SHM), and the Gravity Science experiment.
Mission Profile
Juno launched on 05 August 2011 at 16:25 UTC (12:25 p.m. EDT) from Cape Canaveral Air Force Station. The launch vehicle was an Atlas V 551 with a Centaur upper stage. There was one Earth flyby on 9 October 2013 with a closest approach of about 559 km at 19:21 UT (3:21 p.m. EST). Juno was inserted into its initial 53.5 day Jupiter polar orbit on 5 July 2016, with confirmation of the completion of the 35 minute engine burn received at Earth at 03:53 UT (11:53 p,m, EDT, July 4). The science orbit will be a 14 day near-polar (90 +- 10 degrees) orbit with a perijove of roughly 1.05 Jovian radii (about 4200 km above the cloud tops at its closest) and an apojove of 39 Jovian radii. The spacecraft will be rotating at 2 rpm during the science orbit. Due to the intense radiation environment close to Jupiter, the mission will receive a critical dosage fairly rapidly and is planned to last for 37 orbits. At the end of the mission, currently scheduled for September 2025, Juno will be deorbited and burn up in Jupiter's atmosphere.
Note: Mission information is from NASA's Space Science Data Coordinated Archive.
Spending Summary
| FY 2024 Total | By Jul of FY 2024 | By Jul of FY 2025 | Change from FY 2024 | |
|---|---|---|---|---|
| Obligations | $27.2M | $27.2M | $18.0M | $-9.2M |
| Outlays | $29.0M | $12.0M | $25.0M | +$12.0M |
Comparing Contract Obligations

Running sum of 2 awards. Shows cumulative actual spending by fiscal period. Period 2 represents combined Oct-Nov data (this is a reporting quirk of USASpending.gov). Negative values indicate adjustments or credits. Data last updated: 2025-09-18
Download Options
What are obligations? Obligations represent NASA's legal commitments to spend money — contracts signed, grants awarded, and purchase orders issued. Unlike outlays (actual payments), obligations show when spending decisions are made.
Reading this chart: The chart displays cumulative obligations throughout the fiscal year (October through September). The solid line shows the current fiscal year's running total, while the dotted line (when available) shows the previous year for comparison. This allows you to see spending patterns and track whether funding is ahead or behind the prior year's pace.
Comparing Contract Outlays

Running sum of 2 awards. Shows cumulative actual spending by fiscal period. Period 2 represents combined Oct-Nov data (this is a reporting quirk of USASpending.gov). Negative values indicate adjustments or credits. Data last updated: 2025-09-18
Download Options
What are outlays? Outlays represent actual cash payments made by NASA. While obligations show when spending decisions are made, outlays show when money actually leaves the treasury.
Reading this chart: The chart displays cumulative outlays throughout the fiscal year (October through September). The solid line shows the current fiscal year's actual spending, while the dotted line (when available) shows the previous year for comparison. This reveals the actual cash flow timing and whether spending is keeping pace with the prior year.