James Webb Space Telescope (JWST)

Mission Overview
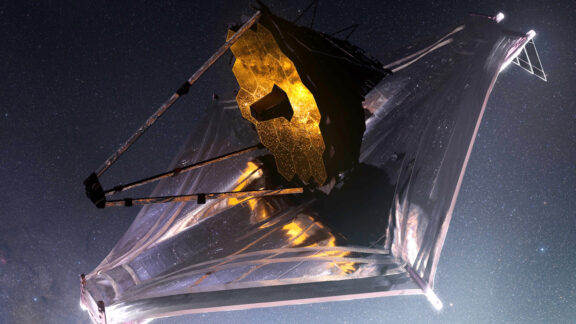
The James Webb Space Telescope (JWST) is a large infrared (IR) optimized space observatory designed to study the earliest phases of the universe, how galaxies formed, how stars and protoplanetary systems develop, and to observe planets in our own and other solar systems. JWST launched on 25 December 2021 into an orbit about the second Earth-Sun LaGrange point (L2), and is planned to operate for 10 years. The telescope has a 6.6 meter diameter aperture and carries four primary science instruments: a Near-IR Camera (NIRCam), a Near-IR Spectrograph (NIRSpec), a near-IR Tunable Filter Imager (TFI) and a Mid-IR Instrument (MIRI). The near-IR instruments operate in the wavelength range from 0.6 to 5.0 microns, the mid-IR instrument covers 5.0 to 29 microns.
Spacecraft and Subsystems
Total mass of JWST is 6500 kg, including the station-keeping propellant. The primary mirror of JWST is made up of 18 hexagonal gold-coated beryllium segments, 1.32 meters wide (flat-to-flat) that fit together to form the 6.6 meter wide (flat-to-flat) mirror surface. There is no mirror in the center. The segments are folded for launch, and are independently moveable. The mirror has a 25 square meter collecting area, it has an effective f/number of 20 and an effective focal length of 131.4 m. A secondary mirror is mounted on three struts above the reflecting surface of the main mirror. The aft optical subsystem, which includes a glare stop, tertiary mirror, and fine steering mirror, is mounted at the center of the main mirror.
The primary mirror is supported by a backplane, which holds the mirror segments and segment motors. The Integrated science module, containing the instruments, support electronics, and cryocoolers, is mounted behind the telescope. The entire telescope assembly is mounted on a large (roughly 10 x 22 meters), multilayer sunshield, which always keeps the telescope in shade so that it can operate at the cold temperatures necessary for IR observations. Cryocoolers are used to further lower the temperatures. The spacecraft bus is mounted on the bottom (sunward) side, and contains the steering and control mechanisms, star trackers, computers, communications, dish antenna, and solar panels.
Mission Profile
JWST launched on 25 December 2021 at 12:20 UT (7:20 a.m. EST) from launch site ELA-3 in Kourou, French Guiana on an Ariane 5 Enhanced Capability-A rocket. Separation and solar array deployment were nominal. It was placed in a 6 month orbit about the Earth-Sun Lagrange 2 (L2) point, about 1.5 million km from Earth, in a plane inclined slightly to the ecliptic plane. The sunshade was deployed 2 days after launch and the primary mirror deployment began 4 days after launch. The spacecraft has completed commissioning and is operating nominally. The station-keeping propellant is expected to last for 10 years.
Note: Mission information is from NASA's Space Science Data Coordinated Archive.
Spending Summary
| FY 2024 Total | By Jul of FY 2024 | By Jul of FY 2025 | Change from FY 2024 | |
|---|---|---|---|---|
| Obligations | $158.1M | $78.3M | $145.2M | +$66.9M |
| Outlays | $52.0M | $104.0M | $105.0M | +$0.0M |
Comparing Contract Obligations

Running sum of 15 awards. Shows cumulative actual spending by fiscal period. Period 2 represents combined Oct-Nov data (this is a reporting quirk of USASpending.gov). Negative values indicate adjustments or credits. Data last updated: 2025-09-18
Download OptionsWhat are obligations? Obligations represent NASA's legal commitments to spend money — contracts signed, grants awarded, and purchase orders issued. Unlike outlays (actual payments), obligations show when spending decisions are made.
Reading this chart: The chart displays cumulative obligations throughout the fiscal year (October through September). The solid line shows the current fiscal year's running total, while the dotted line (when available) shows the previous year for comparison. This allows you to see spending patterns and track whether funding is ahead or behind the prior year's pace.
Comparing Contract Outlays

Running sum of 15 awards. Shows cumulative actual spending by fiscal period. Period 2 represents combined Oct-Nov data (this is a reporting quirk of USASpending.gov). Negative values indicate adjustments or credits. Data last updated: 2025-09-18
Download OptionsWhat are outlays? Outlays represent actual cash payments made by NASA. While obligations show when spending decisions are made, outlays show when money actually leaves the treasury.
Reading this chart: The chart displays cumulative outlays throughout the fiscal year (October through September). The solid line shows the current fiscal year's actual spending, while the dotted line (when available) shows the previous year for comparison. This reveals the actual cash flow timing and whether spending is keeping pace with the prior year.


 Explore Worlds
 Find Life
 Defend Earth

